2/9/13
Heather and Daniele were both out of town today so Heather sent me an article giving a big-picture overview of the element sulfur along with an excel spreadsheet to look at some of the patterns formed with sulfur concentration as it diffused through pyrite. The article taught me some interesting new facts about sulfur, including its huge impact on all life forms. Sulfur is essential for life and in fact, a large portion of your body is made up of sulfur. Sulfur helps to synthesize proteins, which make up every part of your body including muscles organs and tissues. The article also gave me a bit of a history lesson, explaining how the US used to extract sulfur from the tops of salt domes. While the US has stopped extracting sulfur this way, it still remains the largest sulfur producer, recycling sulfur that is a by-product from petroleum refineries. This sulfur can be used in fertilizers, rubber, paper manufacturing and other industrial products. With sulfur also being utilized rather than simply an excess byproduct, companies have greatly reduced their sulfur emissions, choosing to process and utilize this resource instead. The article also talked about how there is some debate as to which sulfur isotopes appeared on Earth first. Theories predict that sulfur isotopes with greater mass were created later, but I want to ask Heather and Daniele more about this next week to better understand these theories.
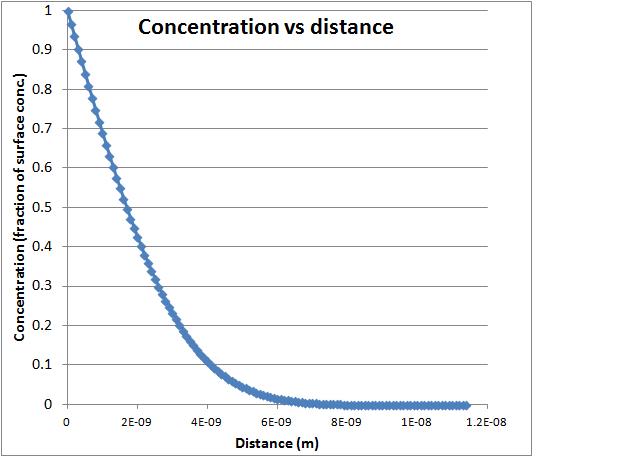
After reading the article I began to look over Heather's Excel sheet. The Excel sheet allowed me to manipulate a graph showing the concentration of sulfur through pyrite. It did this by showing the concentration of the sulfur through each layer of pyrite. As the sulfur got deeper within the pyrite, the concentration decreased, because it took more energy for the sulfur molecules to travel deeper within the pyrite. As the temperature decreased, the sulfur traveled through fewer layers, and this I assume, is because the molecules would have less energy. As I increased the time the sulfur was heated with the pyrite, the slope of the graph got steeper, showing that the sulfur was able to penetrate through more layers over time. If the temperature was increased and the time decreased, the graph never leveled out. The graph below eventually flatlines, when the sulfur concentration reaches zero because it can travel no further through the pyrite. If the temperature was increased, the sulfur molecules would have more energy to travel through the pyrite, but because the time was decreased, they would not have enough time to travel to the maximum depth. The third value I could manipulate on the graph was called D at temperature, which I'm assuming is the average distance traveled through the pyrite at a certain temperature, but I'll have to ask Heather and Daniele next week to make sure. Here is a picture of the graph I was manipulating. You can see how the graph levels off where the concentration approaches zero as it goes deeper within the pyrite.

Hi Kelsie,
ReplyDeleteAfter talking to you I finally understood what the furnaces and heating and the breaking of the tubes are all about. It was amazing to see how much persistance you have in making the vacuumed tubes. When I asked you what is the main goal of your project, you (even though not told) analyzed the things and the results you've got and told me that your mentor is probably trying to figure out how the rocks are formed when earth was created. It makes total sense. Keep up your good analytical skills and your amazing tube making skills! ;)
Yvonne
Very encouraging, Yvonne.
DeleteExcellent work for a "missed day." I am very impressed with all that you learned through these assignments, and I am pleased that you will bring questions with you to your next internship!
ReplyDelete